The Financial Conduct Authority’s (FCA) Assessment of Value regulations aim to improve competition among asset managers and make value more transparent. Columbia Threadneedle Investments has taken the opportunity to consider how it can add further value and provide a great experience to customers.
We spoke to Richard Vincent, head of product, EMEA at Columbia Threadneedle, to find out how they differentiate themselves by creating an exceptional customer experience in their value assessment.
What are the Value Assessment regulations?
The FCA requires managers to look at seven criteria in their value assessments. They must:
- assess market rates for comparable services
- compare investor charges against the costs of providing each product or service to show gross margin
- assess each charge against their charges for other, comparable services
- measure each fund’s performance against its objectives
- assess the range and quality of services they provide to investors, including portfolio management
- pass economies of scale on to investors or reinvest savings into the business.
The FCA’s criteria boil down to three main areas: cost, performance against goals, and service quality. Investors will place varying importance on each of these elements. But, asset managers need to decide how they weigh these criteria and communicate that in their value assessment. This will make it clear to investors how managers intend to provide value.
Embracing the opportunity
Columbia Threadneedle has embraced the value assessment as an opportunity to differentiate. They have tackled the new regulation head-on and put the customer at the centre of their activity.
Richard Vincent makes the value assessment itself of paramount importance and a source of pride. When something is this important to a leader, you can see that in the end product.
‘As an industry, we tend to overcomplicate things,’ he says. ‘We need to produce information that customers want to read and engage with’
To help with this, Richard and his team looked outside the industry for best practices in presenting complex data sets in the simplest way possible.
To give investors a clear view of value at share class level, the team found it needed to bring the information to life with data visualization techniques.
Engaging elements
For 2020 Columbia Threadneedle set out to create an interactive and visual online report, to complement its more traditional PDF. Reflecting changing investor interests and the market backdrop, it also included new metrics on responsible investment and a deeper look at income fund performance.
“These are new reports and customers are not yet familiar with them, or even expect them,” Richard says. “So it’s important that we give them a good experience and help them get to grips with what we are showing them.”
By improving interactivity, relevance, usability and accessibility, Columbia Threadneedle has created a report methodology that can add real value to customers’ daily lives, and given them a handy self-service tool.
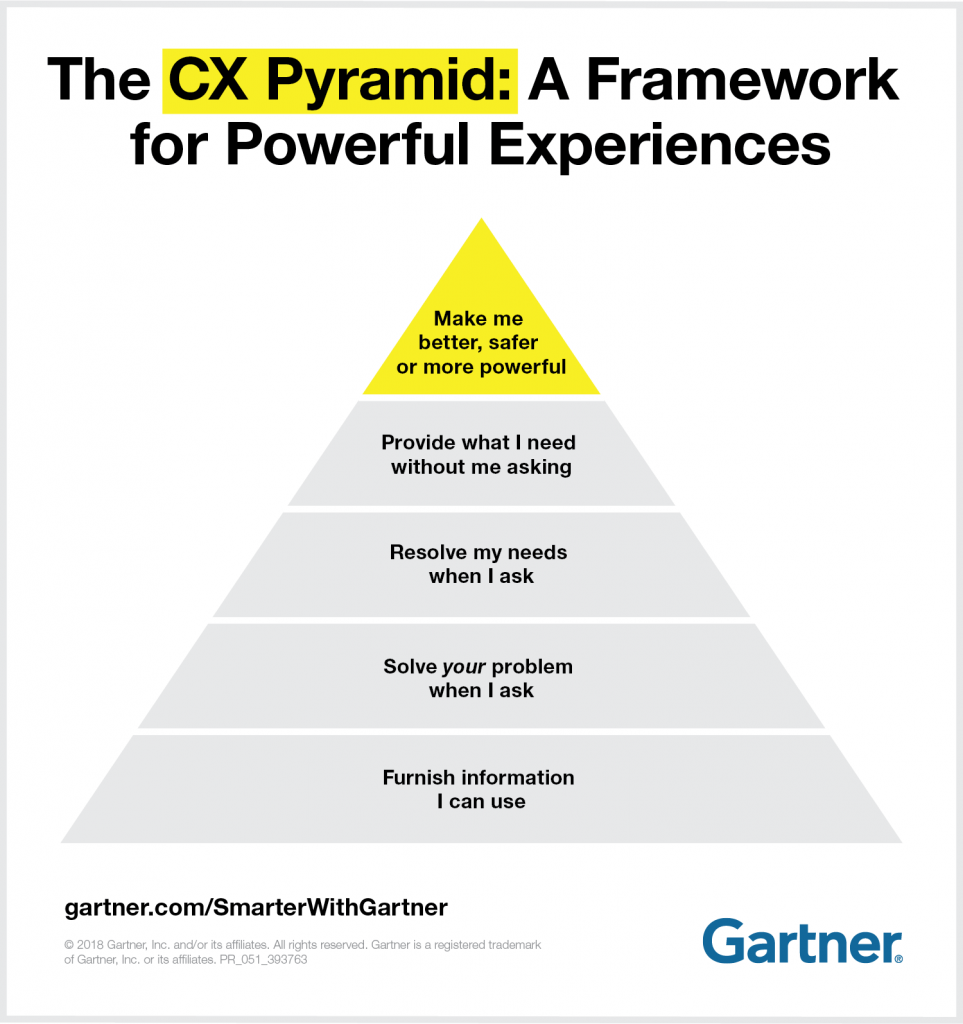
Looking at the Gartner Customer experience pyramid, this report hits the sweet spot for Columbia Threadneedle, making them better and more powerful to their customers.
But how do they do this?
The report comes via an interactive portal, similar to a campaign microsite or creative brand exercise.
The report is divided intuitively across the FCA’s three criteria — service quality, performance and cost — with a value summary acting as an introduction, and a fund value scores section.
Value summary
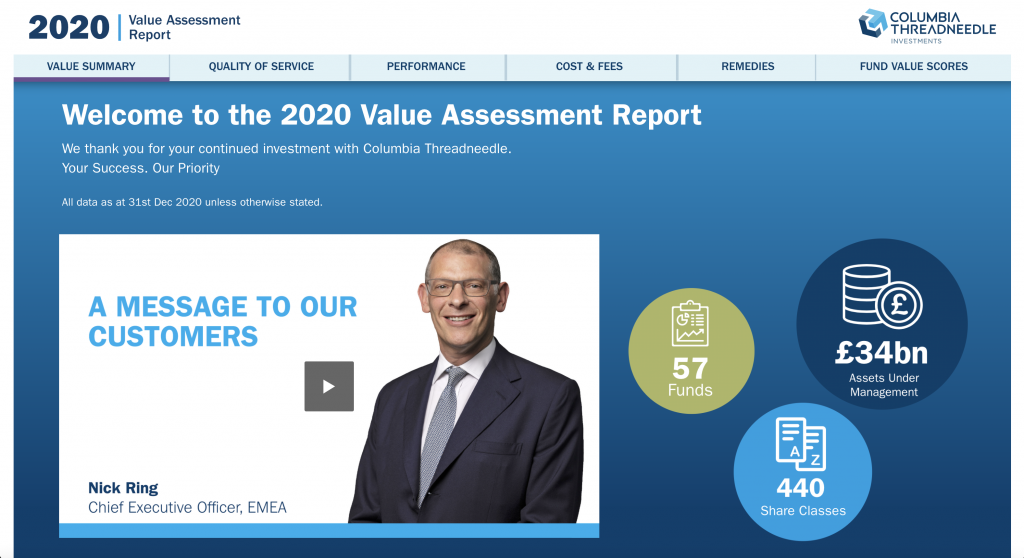
The summary starts with a concise and easy to understand video from Nick Ring, CEO of EMEA at Columbia Threadneedle and is intertwined with clear, animated infographics. It also talks through some of the high-level figures and how to use some of the charts.
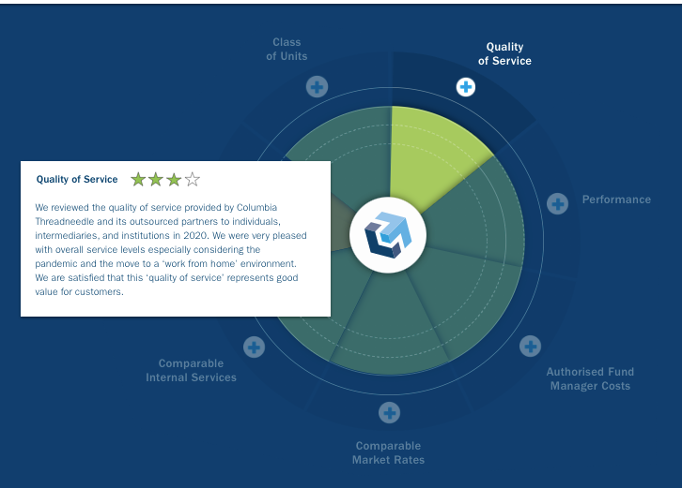
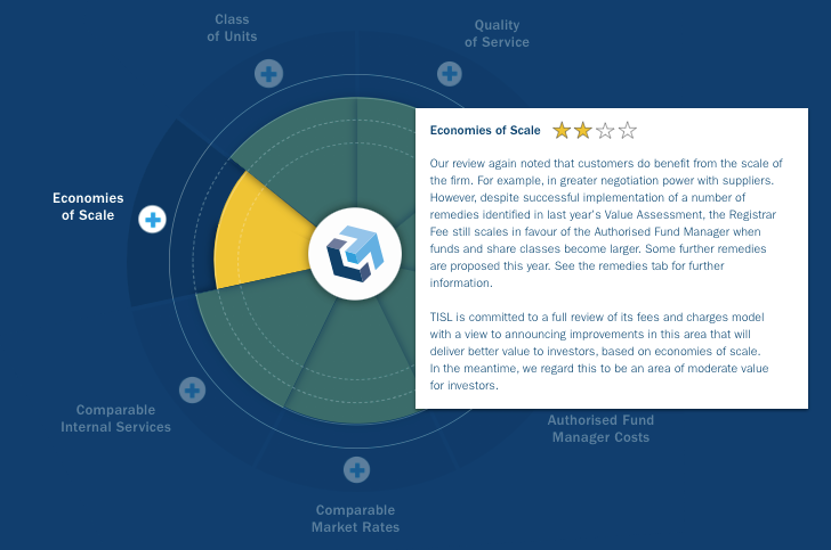
The value summary also includes an easy-to-use, interactive infographic that breaks down the FCA criteria and summarizes the score for each section.


Quality of service

Using a series of well thought-out infographics, clear animations, and interactive sections, the firm delivers the key messages in this section well.
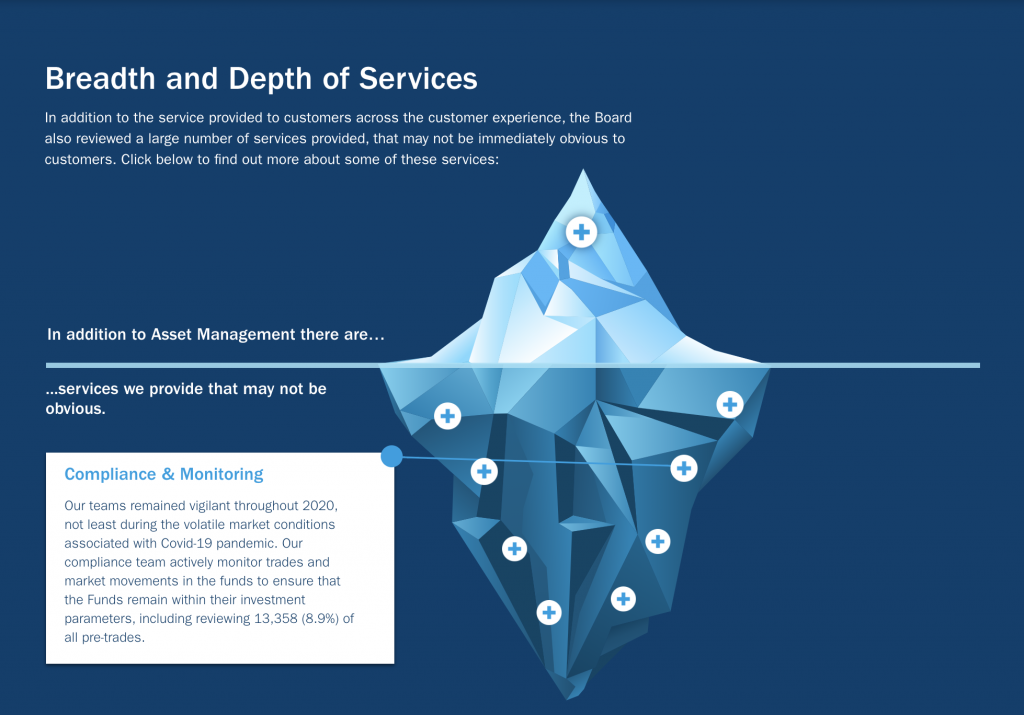
It also identifies the elements of additional value that may not be immediately visible or understood, such as compliance and monitoring, cybersecurity and risk management. These are laid on an image of an iceberg to illustrate how many valuable things happen beneath the surface.
Performance
Columbia Threadneedle has laid out the performance section in a way that makes good customer experience the highest priority. The charts are engaging and intuitive, displaying a vast amount of detail. Every interaction adds value through clarity and supporting the user’s pursuit of information.
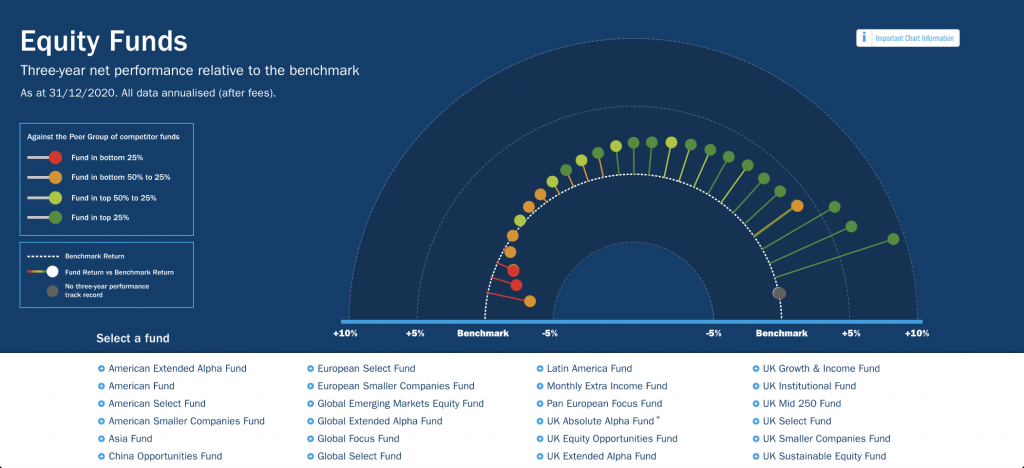
The section features videos, chart information and disclaimers intelligently and responsibly throughout. An animated pulse on chart information ensures it grabs the user’s attention.
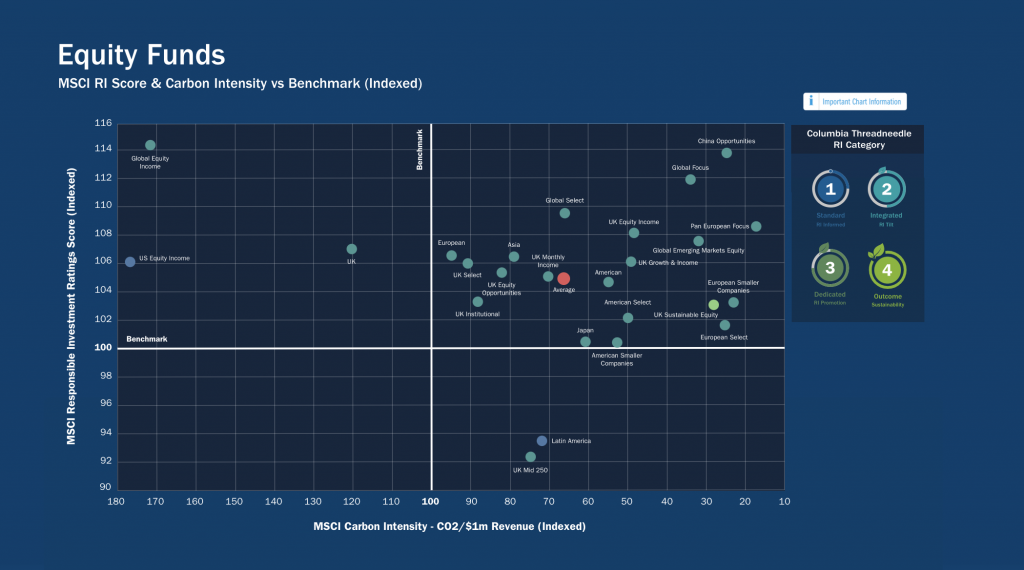
The responsible investing (RI) section of performance uses a new chart layout to fairly represent fund spreads and performance against benchmarks. It cleverly deploys an interactive element that allows users to toggle through the Columbia Threadneedle RI categories.
Costs and fees
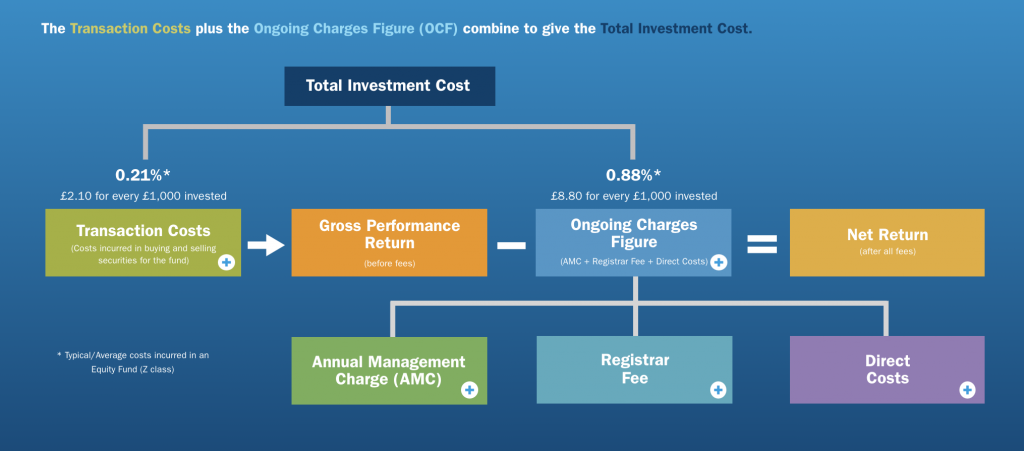
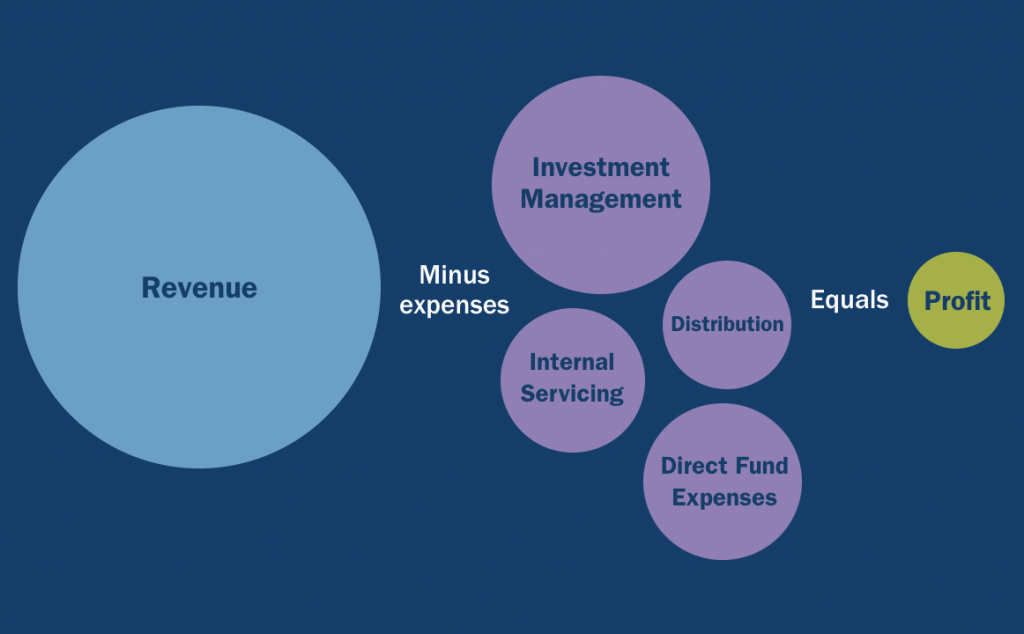
Costs and fees can often be hidden, or at least perceived to be hidden, by an asset manager and so Columbia Threadneedle was deliberate in showing what fees are comprised of.
The bubble chart showing how fund manager costs are calculated brings clarity to each element. The size of each bubble compared to the others adds transparency.
Additional charts in this section cover competitor analysis, share class types, assets under management, comparable services, and economies of scale – all are executed brilliantly.
Remedies
A section like this could easily be missed if placed in an area of the report that may be skipped or not seen. But the importance here is evident as it sits in the primary navigation of the report rather than hidden away in an appendix or sub-menu.
Fund value scores
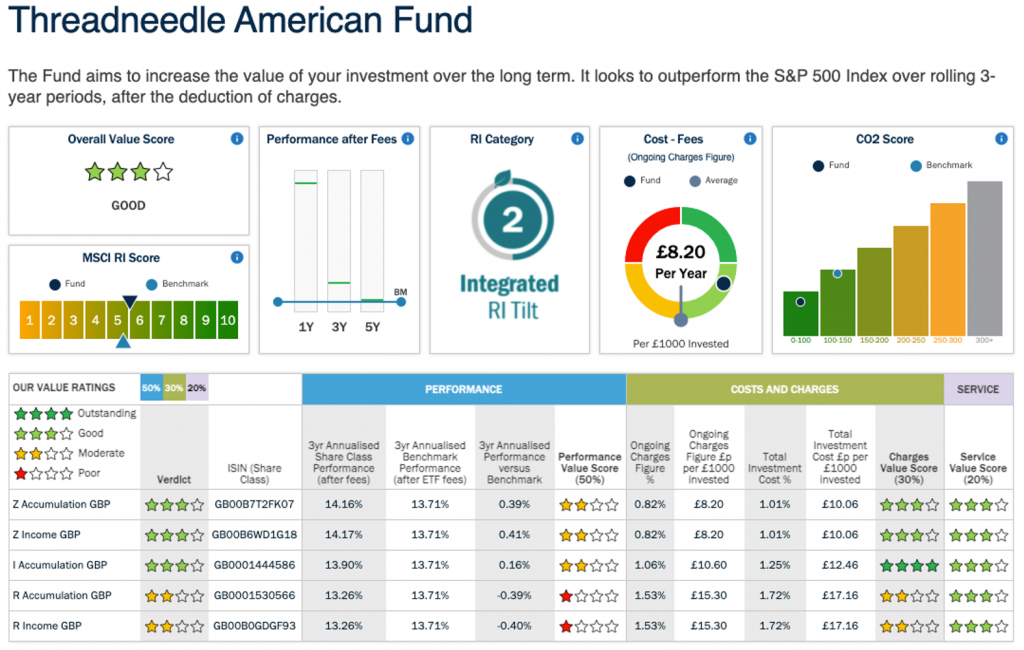
The fund value scores section is a great example of complex data turned into clear and easily understood charts.
Richard says: ‘The inspiration from this section came from What Car magazine’s car prices and data charts that have remained largely unchanged for the last 40 plus years.’
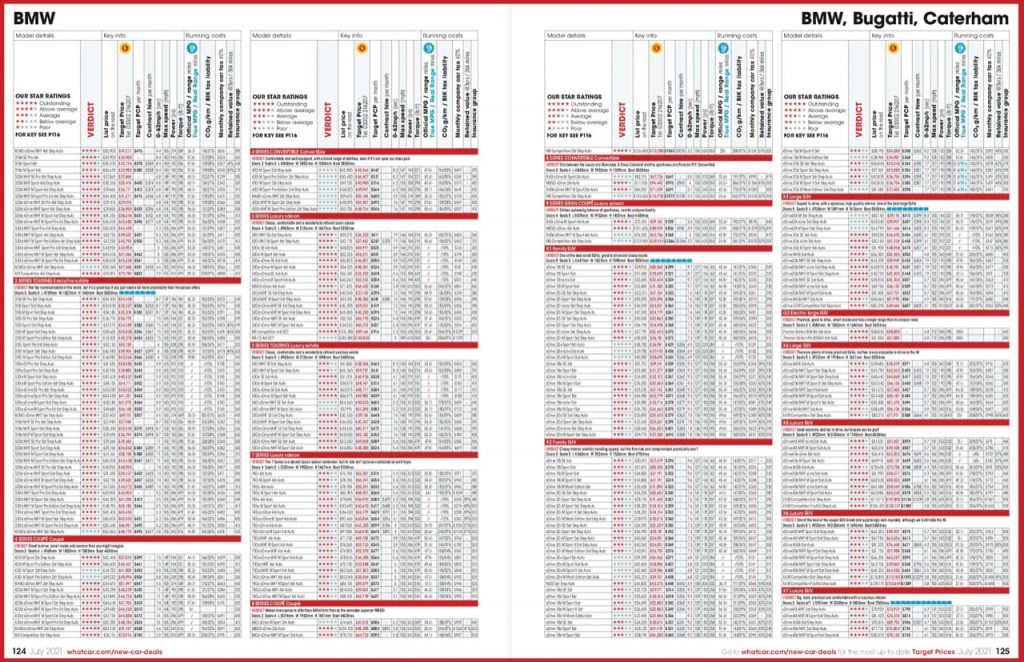
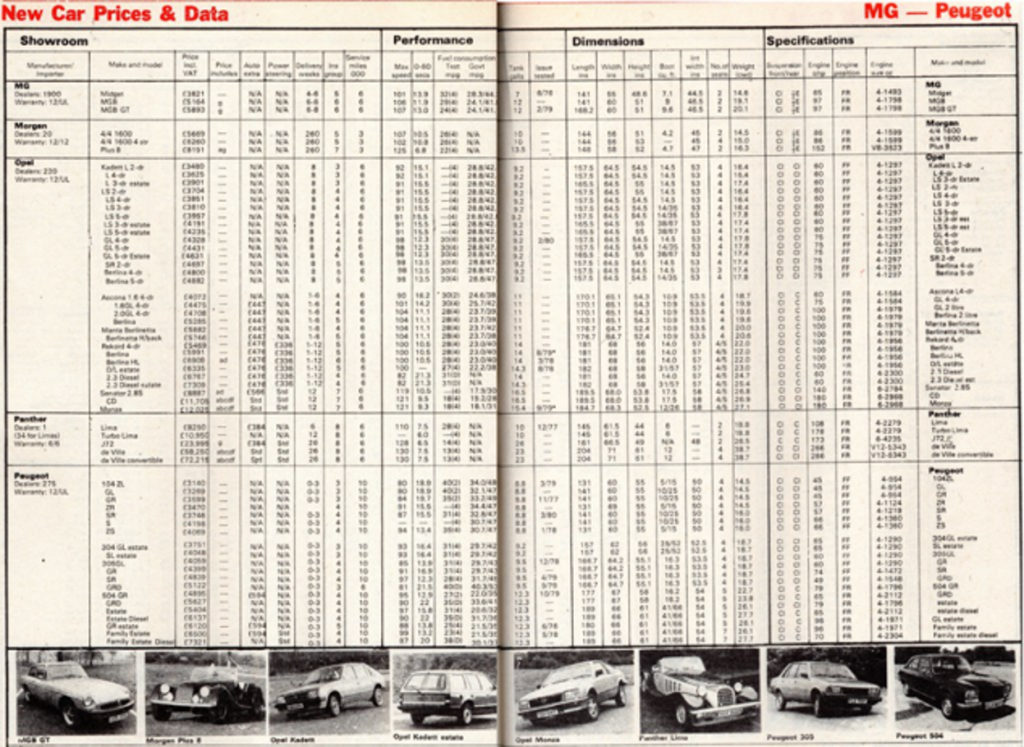
The charts in this magazine portray vast quantities of car data relevant to users assessing the value of a purchase. The primary goal is to give the general public the information they need to understand their options and improve purchasing decisions. This is why the FCA introduced the assessment — to help people make better, more informed investment decisions.
‘Our primary goal here is to give our users a way to get to the data super-fast,’ says Richard.
Conclusion: a new approach to the reporting of value
Mash Patel, founder and CEO of Kurtosys, says: “It is encouraging to see how Richard and Columbia Threadneedle want to bring a fresher, clearer approach to transparency and investor education in their value assessment. This the right direction for the industry and highlights the hidden benefits of efficiencies from using digital technologies.”
So, what’s next for the Assessment of Value report and value labels? More fund management data should be this clear and easy to understand, to give customers more transparency and better views across the industry.
The Assessment of Value is a UK-only regulation. But its value can apply globally. It provides such significant benefits to all investment clients that it is only a matter of time before more broadly accepted and delivered reports are commonplace.
At Kurtosys, we are proud of our fast, scalable and easy-to-use technology. We love solving our clients’ problems with smart applications of technology and creativity. Where it makes sense, we partner for the long run, and that’s often where the magic happens.
Are you struggling to keep up with changing trends? Do you need to automate difficult and costly processes; deliver critical data at pace; or update your user interfaces and website design?
If so, get in touch today. Talk to our team and arrange a demonstration of how our tools and services can add value to your digital transformation.

